Your ad server says it delivered. We check.Your ad server saysYour ad server saysit delivered.it delivered.We check.We check.
AdProof measures every impression independently of the platforms that sell it, classifying invalid traffic, confirming the creative rendered, and validating that delivery matched what you bought. Across CTV, OTT, in-stream video, and the web.
Every campaign on the platform, 30 March to 10 August 2026
Every party in the chain counts the same impression differently.
The DSP counts a win. The exchange counts a served creative. The publisher counts a page event. None of them are measuring whether a person could actually see the ad, and none of them are neutral, because each is paid on the number it reports.
The DSP
counts a win
Paid on the number it reports
The exchange
counts a served creative
Paid on the number it reports
The publisher
counts a page event
Paid on the number it reports
AdProof
a fourth count that answers to the buyer
A flat platform fee on measured volume. No percentage of media, ever.
The invoice
Impression
The DSP
counts a win
Paid on the number it reports
The exchange
counts a served creative
Paid on the number it reports
The publisher
counts a page event
Paid on the number it reports
AdProof
a fourth count that answers to the buyer
A flat platform fee on measured volume. No percentage of media, ever.
Five checkpoints between the impression and the invoice.
Each stage produces its own record. Every impression carries the chain of those records, which is what makes a discrepancy arguable rather than anecdotal.
A tag, SDK, or VAST wrapper reports every delivery event from the client itself, independent of the server that served it.
Each impression is scored for general and sophisticated invalid traffic, and every exclusion carries the rule that caused it.
Render, pixel geometry, and video quartiles are sampled through the exposure window rather than checked once at the start.
Geography, daypart, and segment are checked against the insertion order, with a reason code on every miss.
Verified counts are diffed against the ad server and the invoice, and the difference is filed as a discrepancy.
01Collect
tag
SDK
VAST wrapper
Generalinvalid traffic
rule
Sophisticatedinvalid traffic
rule
Render
Pixel geometry
Video quartiles
exposure window
insertion order
Geography
Daypart
reason code
Segment
differencediscrepancy
Ad serverVerified countsInvoice
01OUT – measured event
02OUT – validity verdict
03OUT – exposure record
04OUT – match verdict
05OUT – discrepancy report
01
01 Collect
A tag, SDK, or VAST wrapper reports every delivery event from the client itself, independent of the server that served it.
tag
SDK
VAST wrapper
OUT – measured event
02
02 Classify
Each impression is scored for general and sophisticated invalid traffic, and every exclusion carries the rule that caused it.
Generalinvalid traffic
rule
Sophisticatedinvalid traffic
rule
OUT – validity verdict
03
03 Exposure
Render, pixel geometry, and video quartiles are sampled through the exposure window rather than checked once at the start.
Render
Pixel geometry
Video quartiles
exposure window
OUT – exposure record
04
04 Validate
Geography, daypart, and segment are checked against the insertion order, with a reason code on every miss.
insertion order
Geography
Daypart
reason code
Segment
OUT – match verdict
05
05 Reconcile
Verified counts are diffed against the ad server and the invoice, and the difference is filed as a discrepancy.
differencediscrepancy
Ad serverVerified countsInvoice
OUT – discrepancy report
Definitions you can hold a vendor to.Definitions you can hold a vendor to.
General and sophisticated invalid traffic reported separately and counted against gross, never blended into one rate. 13,282,798 impressions have come out as GIVT to date, each carrying the reason code that removed it.
GIVT
SIVT
Reason codes
Data-centre
13,282,798impressions removed as GIVT to date
Served against measured
Gross, filtered, and net on the same impression, per campaign and per source. Of 805,447,230 gross impressions measured, 714,246,106 survived invalid-traffic filtering and count-once deduplication.
Every impression resolved from world to country to state to city, and held against the geography the campaign was booked for. 185 countries, 1,020 states and regions, and 8,028 cities resolved so far.
Country
State
City
8,028cities resolved so far
Delivery match
Whether impressions landed against the geography and the plan on the insertion order, reported as a match rate with a confidence level rather than a yes or no. 2,500,069 impressions have landed outside the target.
Exact
Partial
Mismatch
2,500,069impressions landed outside the target
Reach and frequency
Unique reach with duplicate exposure collapsed, plus the frequency distribution behind it, so a reach figure means people rather than cookies.
Unique reach
Dedup
Distribution
Source quality
One row per observed source with volume, valid share, invalid rate, and target match. About 21,999 apps and sites across 4,985 networks observed to date, including delivery from supply that was never on the plan.
Valid share
IVT rate
Off-plan
21,999apps and sites across 4,985 networks
Invalid traffic
General and sophisticated invalid traffic reported separately and counted against gross, never blended into one rate. 13,282,798 impressions have come out as GIVT to date, each carrying the reason code that removed it.
GIVT
SIVT
Reason codes
Data-centre
13,282,79813,282,798impressions removed as GIVT to date
GIVT
SIVT
General and sophisticated invalid traffic reported separately and counted against gross, never blended into one rate. 13,282,798 impressions have come out as GIVT to date, each carrying the reason code that removed it.
GIVT
SIVT
Reason codes
Data-centre
13,282,79813,282,798impressions removed as GIVT to date
GIVT
SIVT
What is measurable where, stated plainly.
Not every metric exists in every environment. Vendors who claim otherwise are modelling. We do not model. Every figure below is either an observed signal or it is reported as unmeasurable.
Coverage: What is measurable where, stated plainly.
Metric
CTV & OTT
In-stream video
Mobile web
Open web
Impression delivery
DIRECT – observed signal
DIRECT – observed signal
DIRECT – observed signal
DIRECT – observed signal
Invalid traffic
DIRECT – observed signal
DIRECT – observed signal
DIRECT – observed signal
DIRECT – observed signal
Duplicate detection
DIRECT – observed signal
DIRECT – observed signal
DIRECT – observed signal
DIRECT – observed signal
Video completion
DIRECT – observed signal
DIRECT – observed signal
DIRECT – observed signal
Geo validation
DIRECT – observed signal
DIRECT – observed signal
DIRECT – observed signal
DIRECT – observed signal
Target match
DIRECT – observed signal
DIRECT – observed signal
DIRECT – observed signal
DIRECT – observed signal
Reach and frequency
DIRECT – observed signal
DIRECT – observed signal
DIRECT – observed signal
DIRECT – observed signal
Viewability
DIRECT – observed signal
CTV & OTT
Impression deliveryDIRECT – observed signal
Invalid trafficDIRECT – observed signal
Duplicate detectionDIRECT – observed signal
Video completionDIRECT – observed signal
Geo validationDIRECT – observed signal
Target matchDIRECT – observed signal
Reach and frequencyDIRECT – observed signal
Viewability
DIRECT – observed signal
N/A – reported as unmeasurable, never modelled
Viewability needs a client-side measurement hook. Almost everything we measure today is in-stream video in CTV, OTT, and mobile web environments, where that hook does not run, so viewability is reported as unmeasurable rather than modelled into a number that fills the gap.
“
Every number in this product resolves to the impressions behind it. A figure that cannot be opened and inspected does not belong in a report, and a blind spot is worth more stated than modelled.
Measurement principle
Four of the surfaces, as they ship.Four of the surfaces,as they ship.
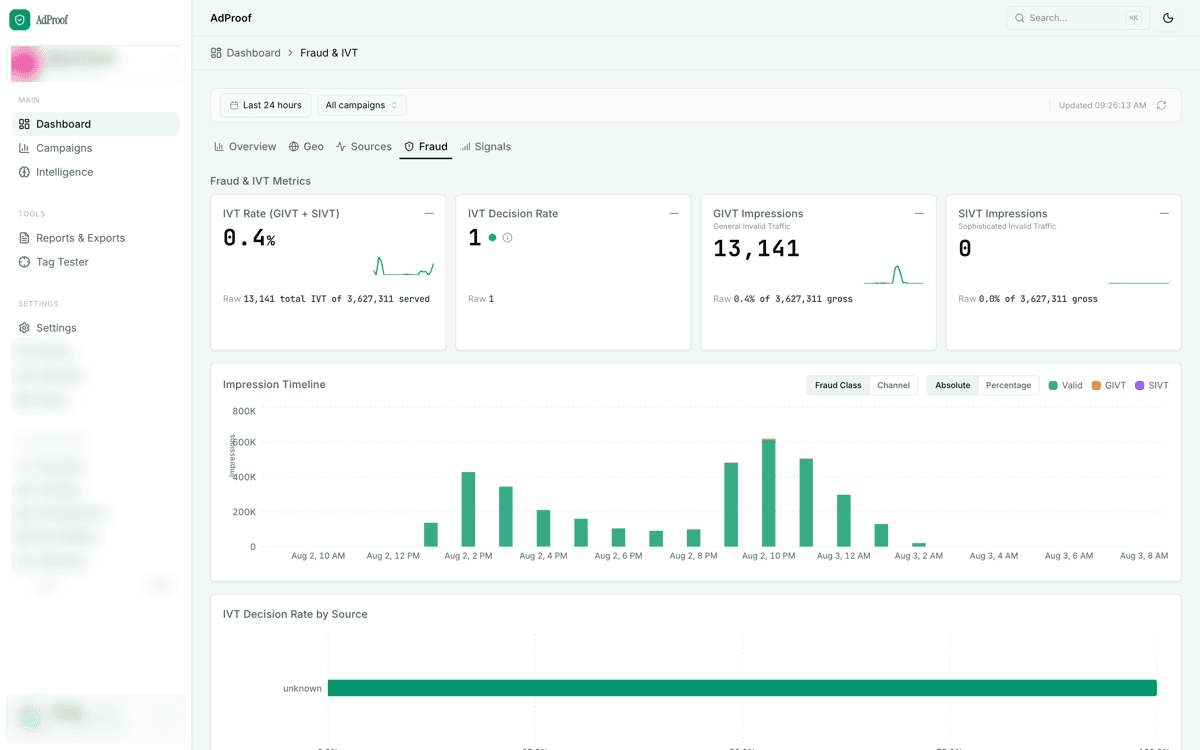
app.adproof.io / dashboard / fraud
Invalid traffic, split by class
GIVT and SIVT counted separately against gross, with an impression timeline, decision rate, and per-source breakdown rather than one blended percentage.
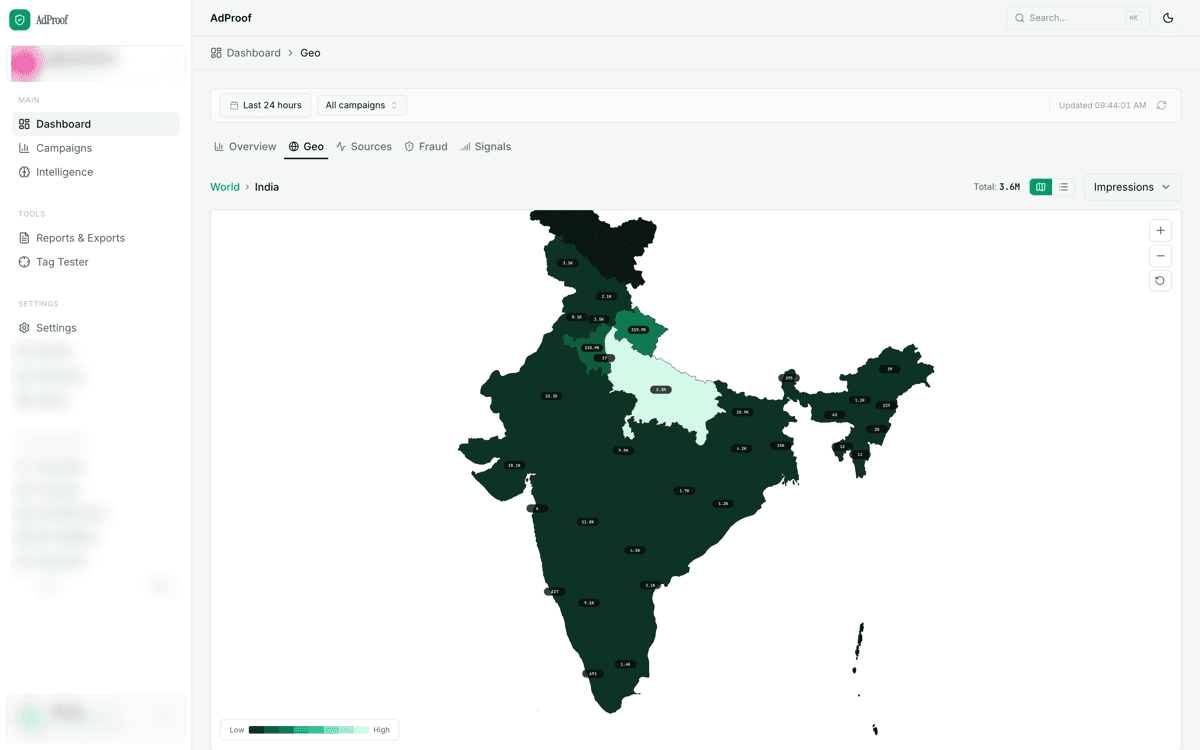
Delivery down to the city
Drill from world to country to state to city, with impressions, clicks, and video completes at every level of the hierarchy.
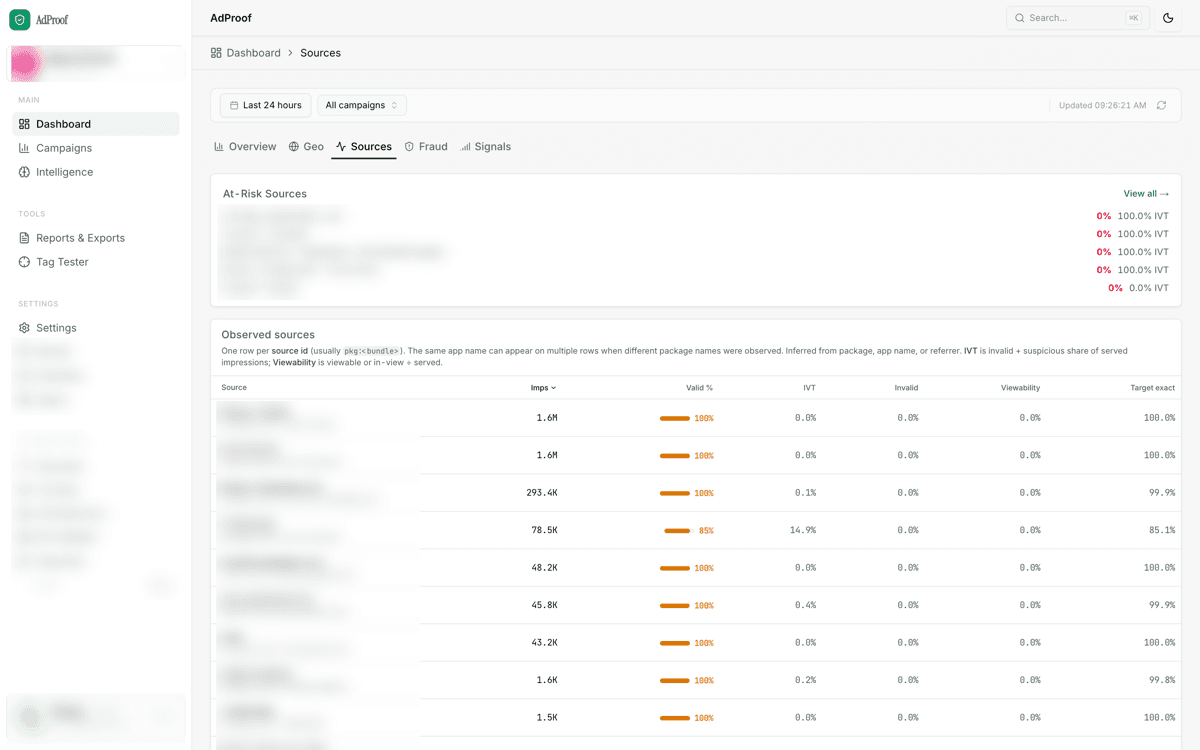
Every observed source, ranked
One row per source id with volume, valid share, invalid rate, viewability, and target match, plus an at-risk list surfaced above the table.
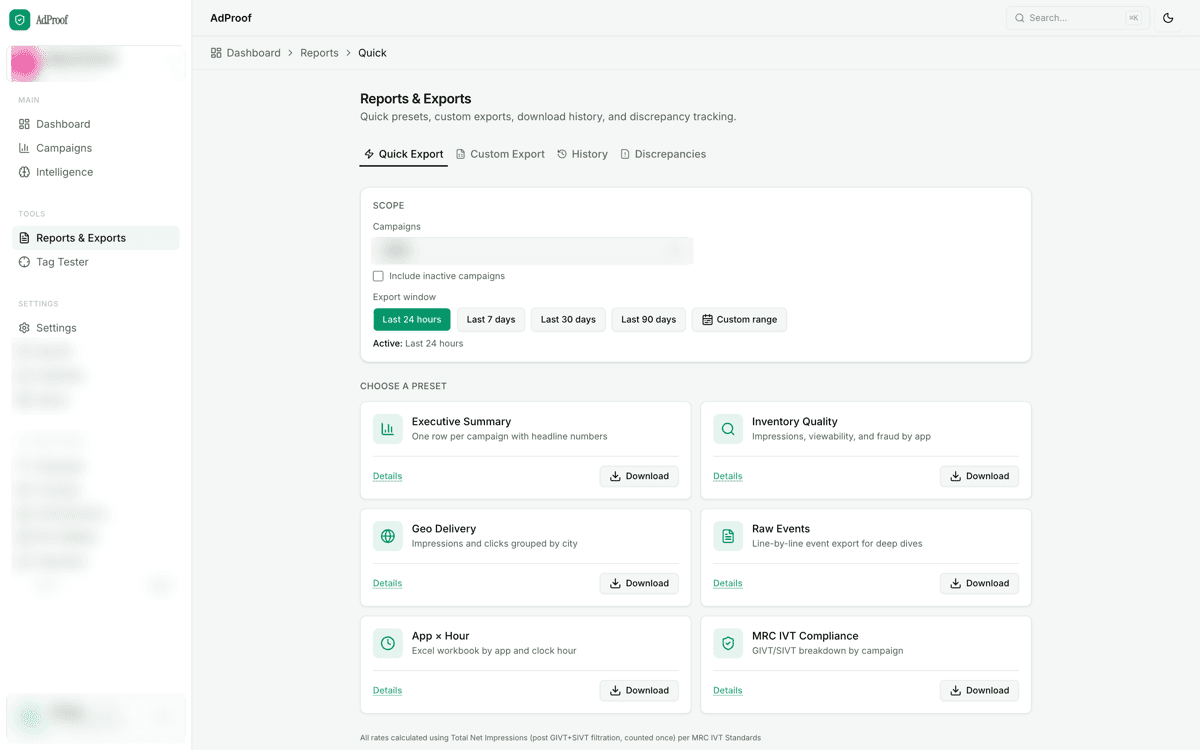
Presets and raw event exports
Executive summary, inventory quality, geo delivery, MRC IVT compliance, or a line-by-line event file, on any window you choose.
Obscured for client confidentiality
Invalid traffic, split by class
GIVT and SIVT counted separately against gross, with an impression timeline, decision rate, and per-source breakdown rather than one blended percentage.
Delivery down to the city
Drill from world to country to state to city, with impressions, clicks, and video completes at every level of the hierarchy.
Every observed source, ranked
One row per source id with volume, valid share, invalid rate, viewability, and target match, plus an at-risk list surfaced above the table.
Presets and raw event exports
Executive summary, inventory quality, geo delivery, MRC IVT compliance, or a line-by-line event file, on any window you choose.
Real results from independent measurement.Real results fromindependent measurement.
See how brands and agencies use AdProof to detect fraud, redirect budget, and verify every impression.
Budget redirected from fraud
$1.2M+$1.2M+
Avg. IVT uncovered
23%23%
Avg. integration time
12min12min
Client retention rate
100%100%
Northstar Foods
Challenge
FMCG
23% of OTT impressions were flagged as invalid traffic by AdProof, while the platform reported 0% IVT.
Result
$1.2M annual budget redirected from fraudulent to verified inventory within 30 days.
IVT detected
23%
Budget saved
$1.2M
Time to detect
< 1 day
Atlas Finance
Challenge
Financial Services
Geo mismatch: 18% of impressions were served in non-target states, violating regulatory compliance requirements.
Result
100% geo compliance achieved within 2 weeks by blocking non-compliant sources identified through AdProof.
Geo mismatch
18%
Compliance
100%
Resolution
2 weeks
Orbit Mobility
Challenge
Automotive
Cross-device frequency was 3× higher than intended, causing brand fatigue and wasted spend on duplicated reach.
Result
Frequency normalized to target cap. 22% improvement in unique reach per dollar spent.
“AdProof uncovered 23% invalid traffic on our top OTT source that the platform's own reports showed as clean. We redirected $1.2M in budget within a week.”
Priya SharmaVP Media Buying, Northstar Foods
“The real-time IVT alerting caught a completion burst anomaly within minutes. Our previous vendor took 48 hours to surface the same issue in batch reports.”
Rahul MehtaHead of Digital, Atlas Finance
“We went from guessing about target match rates to having verified, fraud-adjusted demo data on every campaign. The source quality ranking alone justified the investment.”
Ananya DesaiDirector of Programmatic, Orbit Mobility
“Integration took 12 minutes. Not 12 days, not 12 hours — 12 minutes. And we were seeing fraud-adjusted metrics on our first campaign the same afternoon.”
Vikram PatelCTO, StreamFirst Media
“The frequency intelligence panel showed us that 17% of our OTT spend was hitting overexposed households. That's money we were burning every single day.”
Meera KrishnanHead of Analytics, Pinnacle Retail
“Having independent measurement data alongside the platform self-reports changed every conversation we had with our media partners. It leveled the playing field.”
Arjun NairChief Media Officer, Elevate Agency
“AdProof uncovered 23% invalid traffic on our top OTT source that the platform's own reports showed as clean. We redirected $1.2M in budget within a week.”
Priya SharmaVP Media Buying, Northstar Foods
Start with one campaign. See what the log says.Start with one campaign.See what the log says.
Measure a single campaign alongside your ad server and compare the two numbers. No integration fee, and no obligation to continue.